
Transcriptomic data reveal how an organism or tissue expresses its genes (through transcription into mRNA) at any moment in time, and these data are extremely valuable when trying to describe plant growth, development and environmental response. For example, roots can be starved for the nutrient phosphate and the time course and pattern of gene expression in the root system can be monitored as it responds to this nutrient challenge. This information can be used to identify genes that respond rapidly but transiently to phosphate starvation, and those that switch on later but persist. Identifying gene expression patterns allows gene networks to be constructed, which enables the identification of targets for functional and breeding studies.
Collectively, plant scientists have amassed thousands of RNA sequencing samples (representing billions of transcripts) and deposited them into the National Center for Biotechnology Information (NCBI) database. These data represent great potential for gene discovery, but have tended to be underutilized due to challenges in analyzing data from diverse studies.
In a recent paper in Plant Physiology, Borrill et al. report the development of a platform, expVIP (Expression Visualization and Integration Platform), that enables users to pull together and analyze data from many RNA-seq studies (and upload their own data as well) by comparing them to a single common reference genome sequence. Seeing a gene upregulated in response to a certain stress in multiple independent studies tremendously strengthens our confidence in this observation.
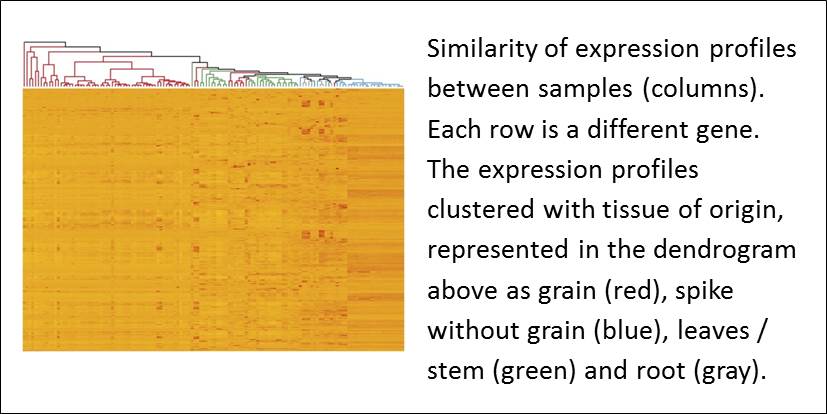 Borrill et al. used expVIP to build the Wheat Expression Browser, enabling them to compare data across many publicly available datasets. In an analysis of more than 400 wheat RNA-seq datasets, Borrill et al. found that in spite of coming from different studies, there was a good correlation of gene expression profiles with tissue of origin; when 1000 randomly selected genes were analyzed, samples from root tended to cluster with those from other roots, etc.
When I spoke recently to Cristobal Uauy, senior author of the expVIP report, he stressed his interest in making RNA-seq data accessible to plant breeder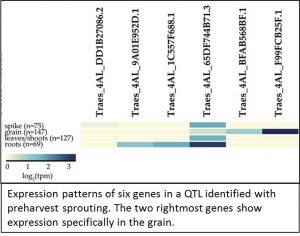 s. The paper by Borrill et al. shows how RNA-seq data can complement genetic mapping and quantitative trait locus (QTL) studies. They examined the expression profiles of six candidate genes in a genomic locus that had been genetically correlated with preharvest sprouting. Two of the six genes in this locus are highly expressed in grain.
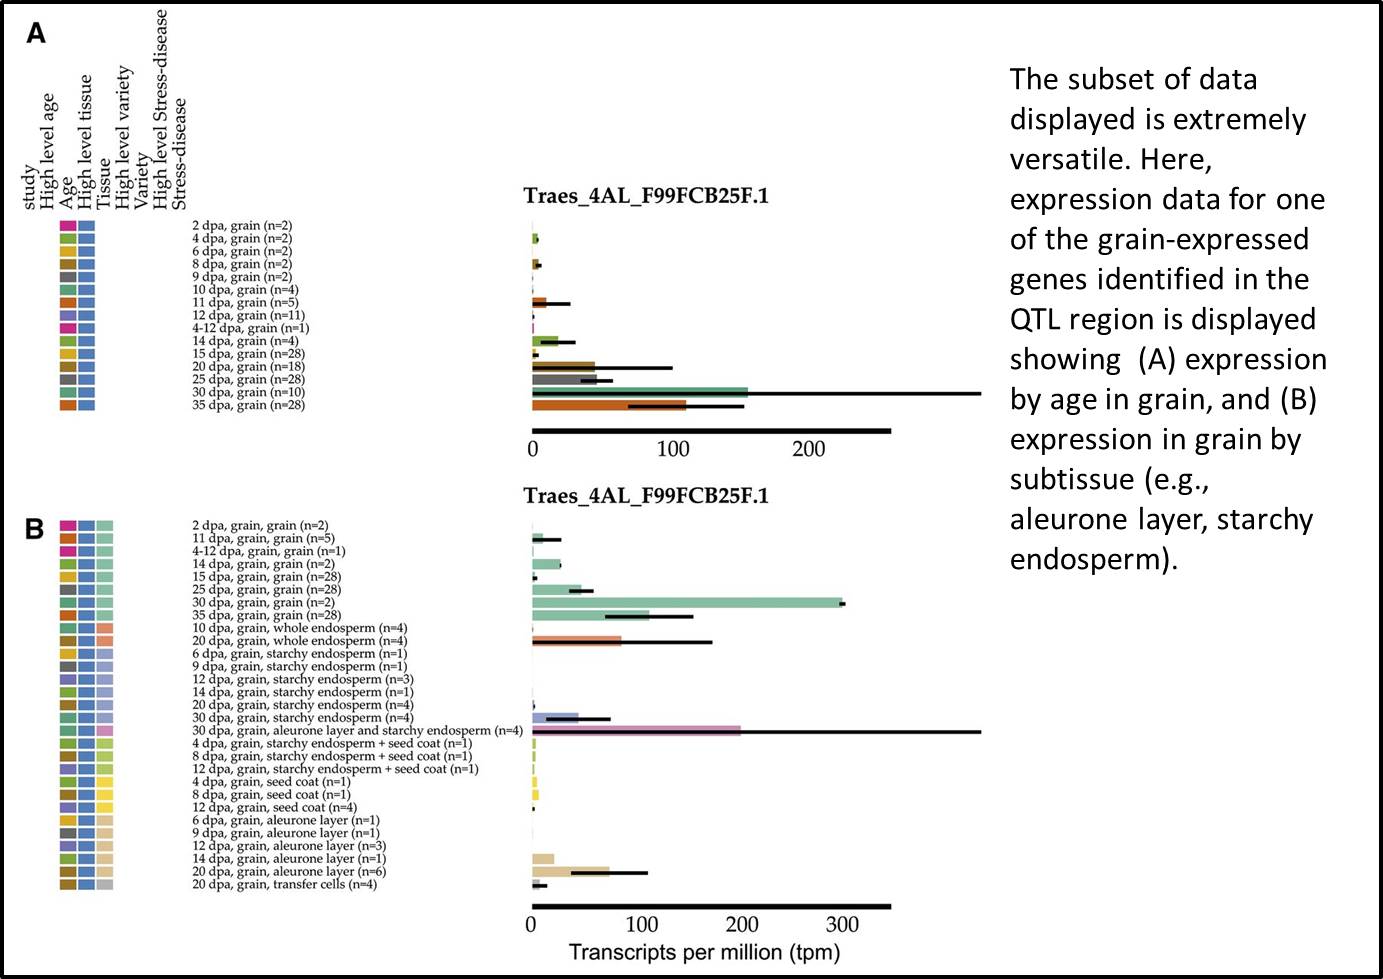
Further analysis revealed that the expression level of one of the candidate genes increases as the grain matures, a pattern consistent with a role in germination control. As a proof-of-concept study, it’s reassuring to know that these grain-expressed genes have been shown to be positive regulators of dormancy (Barrero et al., 2015).
Wheat is a hexaploid plant, making its genetic analysis much more complicated than a diploid plant like Arabidopsis or rice. Borrill et al. demonstrate that although the homeologues (equivalent genes located on different chromosomes) share a great deal of sequence identity, RNA-seq data is sufficiently robust to allow the different homeologues to be differentiated. This is good to know, as many other crop plants have been selected for the increased size that accompanies polyploidy.
We all understand the importance of a good graphical user interface, and the Wheat Expression Browser developed out of expVIP is clear and visually pleasing. I particularly like that it is both simple to use and versatile, two features that aren’t always compatible. See for yourself; a video and tutorial are available to walk you through expVIP’s graphical interface using the Wheat Expression Browser as an example. 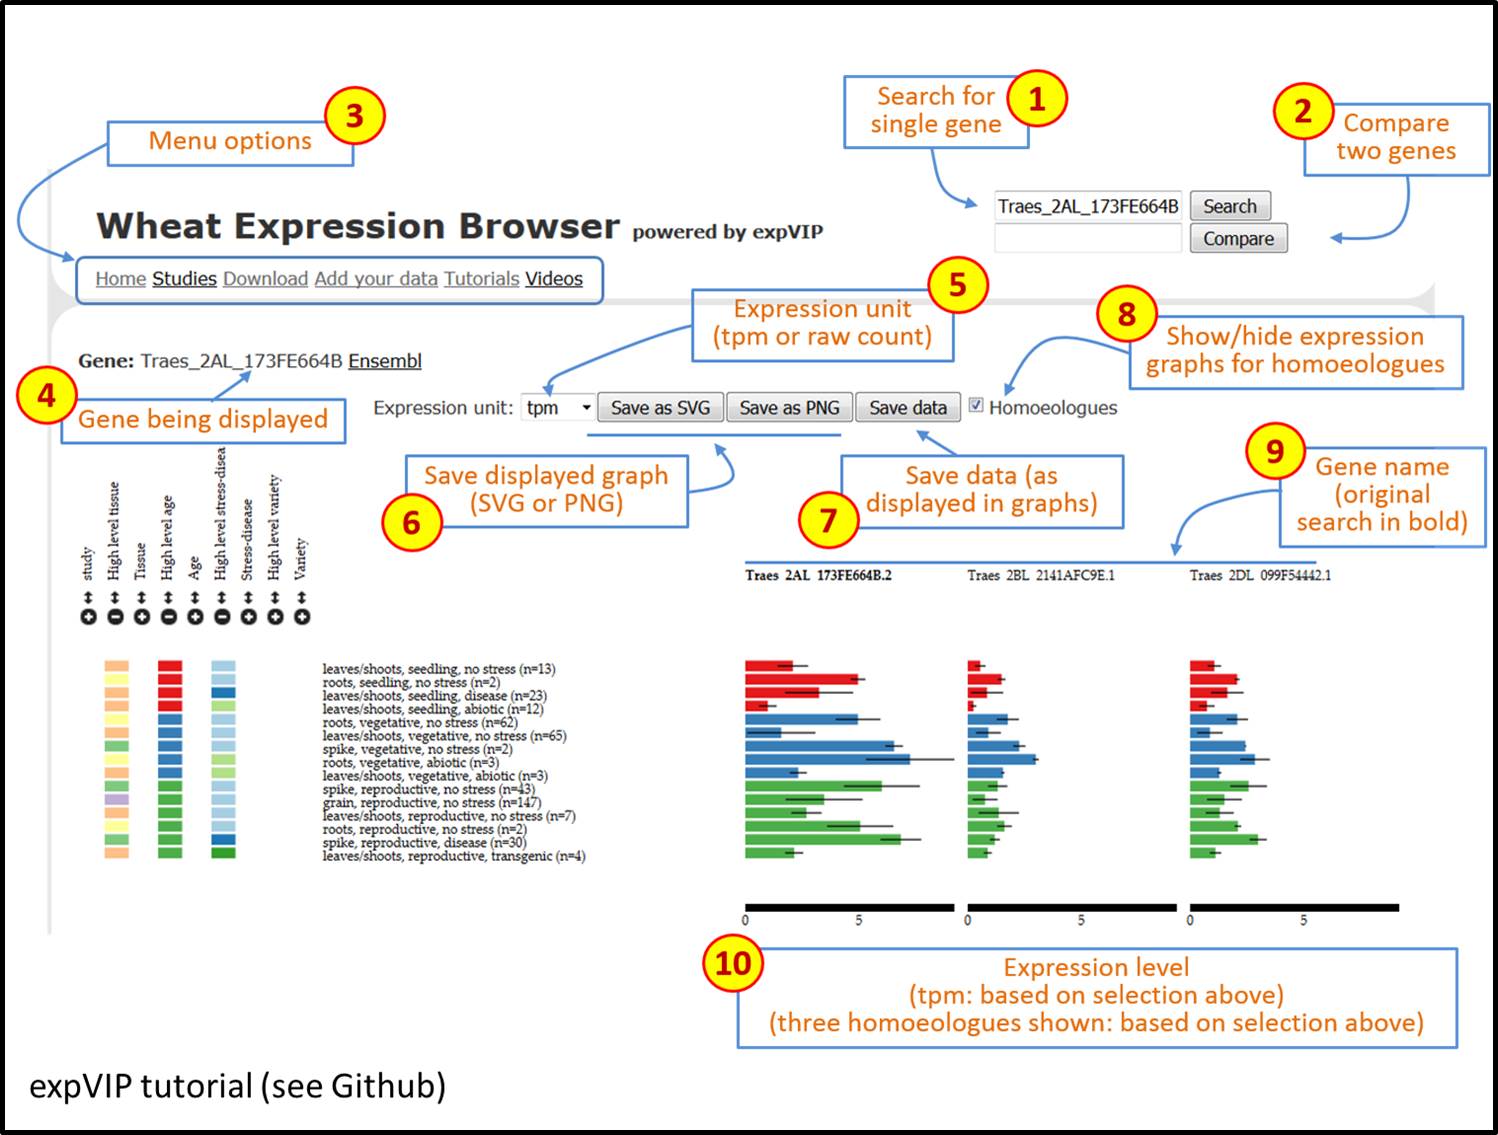
As useful as the Wheat Expression Browser is, the researchers developed expVIP as a versatile platform so that it can be adopted for use in analyzing data from other species. They point out that as other users adopt expVIP, it will be possible to examine gene expression patterns not only between tissues but also between species. Just imagine the insights into evolutionary development, domestication and adaptation that will come from that!
The team, led by Philippa Borril, are also assembling a toolkit of training resources for people who are new to working with wheat, which they expect to release this summer. Watch this space for updates. And in the meanwhile, here’s a video to inspire you to think about wheat and the 100 trillion miracles it takes to feed the world (with senior author Cristobal Uauy introducing his favorite experimental organism).
References
Barrero, J.M., Cavanagh, C., Verbyla, K.L., Tibbits, J.F.G., Verbyla, A.P., Huang, B.E., Rosewarne, G.M., Stephen, S., Wang, P., Whan, A., Rigault, P., Hayden, M.J. and Gubler, F. (2015). Transcriptomic analysis of wheat near-isogenic lines identifies PM19-A1 and A2 as candidates for a major dormancy QTL. Genome Biology. 16: 93.
Borrill, P., Ramirez-Gonzalez, R. and Uauy, C. (2016). expVIP: a Customizable RNA-seq Data Analysis and Visualization Platform. Plant Physiology. 170: 2172-2186.
I’m genuinely impressed by the quality of your content –nice one, keep sharing
Impressive content! This is a valuable resource. Thanks for sharing!